Showing posts with label shale gas. Show all posts

Thursday, February 08, 2018

Energy 106, US oil output now 10+ mbpd

From only 5 million barrels per day (mbpd) oil production in 2010, up to 10.2 mbpd average for January 2018, congratulations America. And EIA's projection is 10.6 mbpd average for 2018. OPEC (mostly dictatorial member-governments like Venezuela, Iran, Saudi) and Russia are quivering.


https://www.aei.org/publication/historic-energy-milestone-us-oil-output-surges-to-new-record-highs-reflecting-americas-deep-pools-of-ingenuity-risk-taking-and-entrepreneurship/

"U.S. producers are making new customers out of some of the world’s biggest oil-importing nations in Asia and Europe, posing a serious competitive threat to the only other countries that produce as much crude: Saudi Arabia and Russia....

U.S. producers now export between 1.5 million and 2 million barrels of crude a day, which could rise to about 4 million by 2022. The nation’s output is expected to account for more than 80 percent of global supply growth in the next decade, according to Paris-based International Energy Agency."

"The Permian Basin of Texas and New Mexico is the engine for U.S. shale production and acquisitions, helping to increase U.S. output to more than 10 million barrels a day in November for the first time in more than four decades. Exxon Mobil Corp. is spending billions to triple output by 2025 from the Permian, where its costs are as low as $15 a barrel."


See here -- two dictatorial governments having a pact to counter US capitalism in oil. And they will use... US technology? :-)

“The exchange in December highlights how Russia and Saudi Arabia have over the past 18 months forged an unlikely alliance in energy, despite being on opposing sides on other issues such as the Syrian conflict.

The traditional rivals, which combined produce a fifth of the world’s crude, now speak with a united voice on energy-related matters and frame their relationship in strategic terms.

The trigger for a rapprochement that seemed unthinkable a few years ago was a common enemy: US shale oil. The collapse in oil prices from 2014, as hydraulic fracturing unlocked a flood of US crude that caught other producers off guard, set their collaboration in motion.”

And this explains why world oil prices, WTI and Brent, are declining in recent day (last chart, above). Trump's "energy dominance" policy will somehow soften the TRAIN de Du30's "expensive oil via higher taxes please" policy?
--------------

See also:

Thursday, June 22, 2017

Oil competition, US vs OPEC

Thank you for competing with OPEC and Russia, US shale oil capitalism. I hope we can go back to below $40/barrel again.


"The resurgence of U.S. shale is already complicating OPEC’s efforts to draw down global stocks in 2017, as well as threatening its market share in 2018.

OPEC now predicts U.S. oil production will increase by 800,000 bpd in 2017, compared with a projected decline of 150,000 bpd at the time of its December forecast (“Monthly Oil Market Report”, OPEC, June 2017)." http://www.reuters.com/art.../us-oil-opec-kemp-idUSKBN196037

"Thanks largely to the domestic hydraulic fracturing revolution, the U.S. has been the world’s top natural gas producer since 2009, passing Russia, and the top producer of oil and petroleum hydrocarbons since 2014, passing Saudi Arabia." https://www.wsj.com/.../lessons-of-the-energy-export-boom...

Monday, March 07, 2016

Energy 59, Cheap oil and the OFWs

Last week, I was invited by Kapatiran DLSU, a student organization, plus some development studies classes, to speak on this subject.


My presentation was divided into two parts, with an open forum after Part 1, before proceeding to Part 2.

Part 1: Cheap oil and gas
1. Oil and gas, prices and output
2. Oil and gas, number of rigs vs. production
3. Medium term outlook
4. Concluding notes

Part 2: Employment impact
1. Macroecon, jobs indicators, rich & emerging markets
2. Global remittances by country
3. OFWs destination countries
4. Saudi government finance
5. Concluding notes


Glut in oil storage is mainly due to fast growth in US shale oil output, from 5-6 M bpd in the previous decade to current 9+ M bpd. An  interesting chart below -- as the number of shale rigs decline, output increases. Meaning only high output rigs are running while the smaller output rigs are closed, temporarily.


US and global demand stabilizing while supply keeps expanding, meaning the supply curve moves to the right. The decline in prices (from P1 to P2) is much larger than the increase in output from Q1 to Q2.


Yes, no mercy for both Saudi and non-OPEC oil exporters. Both did not cut their output. The uncompleted fracking wells are just closed temporarily.


U.S. crude oil production (including lease condensate) increased during 2014 by 1.2 million barrels per day (bbl/d) to 8.7 million bbl/d, the largest volume increase since recordkeeping began in 1900. On a percentage basis, output in 2014 increased by 16.2%, the highest growth rate since 1940.


If already low nominal  prices are deflated or adjusted for inflatio  in to get real prices, it’s down to $20, $17 a barrel.

The same story can be said  of natural  gas. The number of shale gas rigs is declining but the overall output is rising.


Concluding notes:

* Cheap oil is good. Especially for us oil consumers. Cheaper cost of air, land and sea transport. Cheaper cost for farmers using tractors, harvesters; for fisherfolks; for manufacturing, etc.

* Cheap oil though has negative effect on many OFWs based in Saudi Arabia and UAE.

* Cheap oil hurts dictatorial governments more, many of them in OPEC. Like Saudi Arabia, Iran, Venezuela. Also outside OPEC like Russia.

* Global capitalist competition is good. OPEC oil vs. Russia oil vs. US shale oil and gas vs. others

* Medium term outlook, cheap oil will stay. Something like $40/barrel average for the next few years.

The  open forum questions centered on the medium term outlook, for how long is cheap oil going to be sustained. Then I continued in Part 2.

Part 2: Employment impact

1. Macroecon, jobs indicators, rich & emerging markets
2. Global remittances by country
3. OFWs destination countries
4. Saudi government finance
5. Concluding notes


Notice that unemployment rate in rich and middle class economies have tapered off, somehow. Meaning the feared dislocation of workers from oil-dependent sectors and sub-sectors could be bloated.


Fiscal effect on Saudi Arabia -- from budget surplus to budget deficit, rising from $14 B in 2014 to $98 B in 2015, highest in Saudi’s fiscal history, despite significant spending cuts. Meaning lower budget for public health, social sectors, physical  infrastructures, etc. Both direct and indirect spending (via private contractors and suppliers).


I think one indicator if there are indeed "so many" displaced workers now back in the country is the volume of vehicle traffic at NLEX, SCTEX, SLEX. If there is high increase in vehicle volume in 2014 vs 2015, that means more motorists are driving more frequently, the tourism sector in many provinces in Luzon -- and the rest of the  country -- is booming, thanks to cheap oil.

Governments should not introduce new oil taxes or raise existing ones because that would mean lesser freedom and mobility for the people.

The full 27-slides powerpoint is posted in my slideshare account.
-------------

See also:

Sunday, October 25, 2015

Business 360-29, Low oil prices and energy development in South Asia

* This is my article in Business 360, a monthly magazine in Kathmandu, Nepal, September 2015 issue.

Low oil prices and opportunities for energy development in  South Asia 

Low world oil prices are seen as “negative” by many analysts because they pull down stocks and equity values of many energy companies and contribute to deflationary pressure. But in the perspective of ordinary oil and energy consumers, they are good and positive news.

Whether people move and transport themselves, their  family or  other people, or they move various commodities, oil is a very important raw material for such large-scale transportation of goods and people.

As of August 24, 2015, West Texas Intermediate (WTI) prices were trading  at $38-$39 a barrel. These are lower than the levels reached during  the sub-prime and housing prices turmoil in the US that spread to the rest of the world in 2008-2009. And these are prices that were seen in 2004 and earlier years.

Oil companies and oil-exporting countries are fighting for world market share and care less about the price, whether  they are OPEC or non-OPEC member-countries. With the revolution  in drilling technology and shale oil fracking, it seems that the average break even price for many companies could be $30-$35 a barrel, so that at $38, they can still make marginal profit.


Continuous innovation and development  in drilling  technology using big data and robotics have significantly reduced the cost and time of drilling and finding oil. From a Forbes report last August 23, an article said that “Faster drilling means cheaper drilling, which makes marginal oilfields economical at lower oil prices. It costs about $20,000 a day to contract an onshore drilling rig, so shaving four days off a well yields an immediate $80,000 in savings. If smarter computers can reduce a rig’s head count by one, cut another $200,000 a year in salary, benefits and accommodations."

Many developing countries in South and South East Asia can  take advantage of this to hasten their growth and development. Below are some basic  data on their total primary energy supply (TPES) in tonne of oil equivalent (toe) and electricity consumption. High TPES means higher energy input for growth and development.


In South Asia, Nepal and Bangladesh are producing energy at very low levels. In South East Asia, the Philipines, Cambodia and Myanmar need further expansion in energy production.

At below $40 a barrel, diesel oil power plants that  are used as peaking plants (used only during peak hours) may be used for baseload power (capable of running 24/7) production.

The cost of air, land  and  sea transportation should decline significantly and hence, more people and goods can be transported at lower costs. Minus the effects of currency depreciation, tourism and related sectors (airlines, hotels, restaurants and other shops) should  benefit from cheap oil.

For Nepal, Bangladesh, Cambodia  and Myanmar, today are good days to expand productive capacities, from fishing to farming to trucking and air/sea cargos.


Their governments should  resist temptations to raise oil and energy taxes because this will negate or cancel out the gains from low  oil  prices.
------------

See also:

Friday, February 20, 2015

Business 360 21: Cheap Oil and Nepal

* This is my article for the monthly magazine published in Kathmandu, Nepal, January 2015 issue.
----------

Cheap oil: an opportunity to deregulate and demonopolize the oil industry
  
The continued decline in global oil prices is at least good news for many developing economies who can take advantage to grow faster. After all, most economic activities require oil input – from buses and cars, tractors and fishing boats, airplanes and ships, bulldozers and backhoes, oil power plants and generator sets, and so on.

Current low prices have not been seen since six or more years ago. Below are the charts for the last five years (left) and past month (right) of West Texas Intermediate (WTI) crude prices.

Figure 1. Crude oil price at WTI, last 5 years and last month ending December 26, 2014


While some big oil companies and their allied firms in other industries are not happy with this fall, most
industries and sectors that rely on bought oil products are relieved. People who save on their land travels because of high oil prices can now drive and visit more places as their cost per trip has significantly gone down. Airlines, shipping lines and bus lines should be capable of cutting their fares as their  fuel costs have significantly declined. All these help expand the production of goods and services, eventually fuelling economic activates.

But why have world oil prices gone down this much recently? The quick answer could be the expansion in oil supply, much larger than the expansion in demand for oil.

On the supply side, the huge output from US shale oil, plus Canadian oil have swamped many oil importing countries’ inventories, and OPEC member countries did not cut their collective output as they used to do, retained its output at around 30 million barrels a day in order to protect their global market share.

On the demand side, some industrial countries experienced low or flat growth. Japan even went into a recession in 2014. Thus, their oil demand either went flat or negative. Meanwhile cars’ fuel efficiency worldwide is improving, meaning they can run longer stretch of roads with the same amount of oil.

The reduction in global oil prices is also reflected in Nepal’s local oil prices, as shown below.

Figure 2. Diesel prices in Nepal, in US$ per liter, period ending December 22, 2014


From this writer’s limited readings of the oil sector in Nepal, three interrelated issues stand out.

First, the oil shortage in some areas of Nepal in recent weeks, an ironic situation since the world is awash with an over-supply of cheap oil. The reason given was that the “fuel supplied by Indian Oil Corporation (IOC) is not as per the standard set by Nepal Oil Corporation… officials are undecided on whether to return them to India or supply them in the market.” (source: Nepalupclose.com)

Second reason is state monopolization of oil trading through the Nepal Oil Corporation (NOC). Oil prices are fixed by NOC’s board, which is composed of officials from the Ministry of Commerce and Ministry of Finance, among others.

Third reason could be oil supply monopoly of Indian Oil Corporation Limited (IOCL) to NOC. IOCL is also a state-owned enterprise of  India, the biggest corporation there and among the biggest firms in the whole world.

The first problem is temporary and not permanent, but it can occur again in the future because it is an inter-monopoly agreement and consumers normally have zero  choice in a game between monopolies.

The second problem is slowly being addressed when  NOC introduced partial fuel price deregulation in September 29, 2014, where “NOC… will let oil prices go up or fall by up to two per cent two times a month.” (source: Himalayan Times, October 19, 2014). A better approach is to fully  deregulate oil pricing, competing oil companies and  gas stations can set their prices based on the extent and degree of competition.

The third pProblem can be addressed when the oil industry is deregulated as competing oil companies can source their oil from other suppliers.

These measures are easier said than done but the public have already seen and experienced how things are working or not working under a state monopolized oil industry.

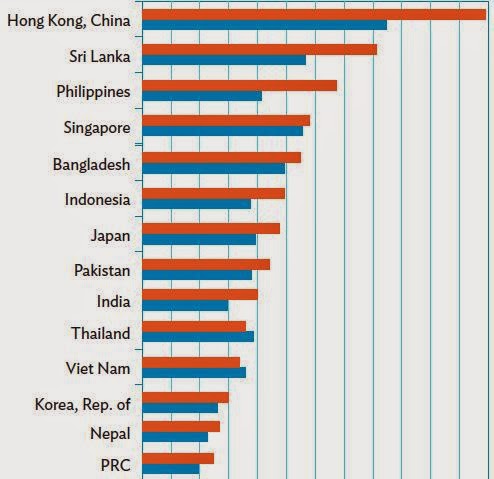
Meanwhile, many Asian economies have experienced improvement in energy efficiency per unit of economic output. Many of the economies that realized high efficiency gains in the last decade had access to cheap energy.

Figure 3. GDP per unit of energy use, 2000 (blue) and 2011 (red), constant PPP $ per kilogram of oil  equivalent (HK’s level is $24)

Source: ADB, Key Indicators of Asia and the Pacific 2014.

This means that in Hong Kong in 2011, for every kilogram of oil equivalent, its GDP rose by $24, an improvement from only $19 in 2000. In the case of Nepal, for every kilogram of oil equivalent used in the economy, domestic output in 2011 rose by almost $6.

Low world oil prices plus rising energy efficiency are good combinations to implement market reforms where competition by different players is the main regulator in protecting the public with more affordable prices of oil and other energy products. Competing players will have wider leeway to adjust not only to each other but also to their customers, big and small groups alike.
------------- 

See also:
Trade and Development in Asia, December 25, 2015 

Monday, January 26, 2015

Cheap Oil and Rising Abundance

My second lecture before graduating management engineering students of Ateneo in their Development Economics class was about cheap oil. Thanks again to their professor and my friend, Joey Sescon, for allowing me to share these data and observations to the students.


As of last weekend, WTI crude oil closed at $4549 a barrel while Brent oil closed at $48.79 a barrel. Wanting to go down to $40 or go up to $50.

Current prices are attempting to go down  the levels in 2009.

The low prices in 2009 were due to global financial turmoil and hence, reduction in demand. Today's low prices are due to huge oil supply.


At 9+ million barrels per day, the US' oil output is similar to Saudi Arabia's, if not larger.


Japan and Europe are still grappling with anemic growth, even threat of deflation, thus oil demand is almost flat. Besides, modern cars, buses, airplanes, are more fuel efficient. They can travel the same distance at lower fuel consumption. It is in Asia and other emerging markets that oil demand is rising significantly.


The PH economy to be the biggest winner in the current cheap oil, good news from Bloomberg.


A brief presentation, these were my conclusions.


* See also, Fat Free Econ 56: Major Global Economic News of 2014, January 07, 2015

Tuesday, July 17, 2012

Fat-Free Econ 16: Coal, Climate and Government

* This is my article yesterday in TV5's news portal.
http://www.interaksyon.com/article/37648/fat-free-economics-coal-climate-and-government
--------

Coal is a cheap energy source for developing economies like the Philippines. We cannot develop fast enough, create more jobs fast enough, if we are groping in the dark with frequent power outages like what we experienced in the early 1990s. Or if a big portion of household and company expenditures are spent on high power rates.

During a Platts forum last week, one of the speakers, Ismael Ocampo of the Department of Energy, presented the following data:

Sources of power generation in the Philippines, percent of total.


Source: Ocampo, Ismael, “Overview of the Philippine Coal Mining Industry”, July 11, 2012.

Total power generation in 2009 was 61,943 gigawatt-hours and in 2010, 67,743 GWh, for a 9.4 percent growth. Notice the big jump in the share of coal from 2009 to 2010, and the decline in natural gas, geothermal and hydro.

This shift is also shown in the increase in local oil consumption, by a million metric tons per year on average. Both local production and importation were also rising.

Coal supply and demand in the Philippines, 2007 to 2011, in million MT


Source: Ocampo, Ismael

What drives this rather fast shift to coal? A second speaker, Cecilia Quiambao who is associate editor of Platts for coal, provided some answers. She showed these charts:

Global coal prices, December 2009 to May 2012.


Prices were increasing in 2010 with peak points at around $130 per ton in January 2011 for the Richards Bay (S. Africa), then mild decent for the rest of 2011, going down to around $98 per ton by May 2012.

Now is the time to further industrialize and modernize with declining global coal and other energy prices. This trend is supported by other developments, as Quiambao illustrated:

- US coal export capacity could reach 270 million MT in 2016, according to UBS. US coal producers can flood the international market once pricing becomes attractive to 270 million MT from the current 158 million MT, increasing the disruptive nature of US suppliers on the seaborne market.

- Bain & Co. said cheap shale gas is set to dethrone coal as the preferred source of power generation in the US in the long term as it is widely available and cost effective. The availability of cheap shale gas in the US and its wide use for power generation has led coal producers to export more to Europe and Asia at cheaper prices.

- Korea South East Power received offers for at least 1.3 million MT of coal in its two recent spot tenders for a combined 260,000 MT.

Thus, supply is five times the amount demanded in the case of Kosep. It is a buyer’s market, thanks largely to the further development of shale gas in the US and other rich economies.

Coal is not an “evil” energy source that is said to contribute to “man-made warming” as portrayed by the UN, Al Gore and some environmental groups like Greenpeace and World Wildlife Fund. Climate change is mainly natural, warming-cooling-warming-cooling in multi-decadal cycles, regardless of how many billions or trillions of tons of coal is burned worldwide each year. So while global warming was true, global cooling was also true, and is happening now.

See below the trend in global air temperature (UAH and RSS satellite data), average for northern hemisphere, tropics, southern hemisphere, and carbon dioxide (CO2) concentration in the atmosphere:

Air temperature vs. CO2 concentration, 1979 to May 2012


Source: Friends of Science, http://friendsofscience.org/

From January 2002 to May 2012, as CO2 kept rising to nearly 400 parts per million, global temperature was declining or cooling by 0.04 degrees centrigrade per decade. “Causality” between more CO2 and “more global warming” is not seen or happening. What we normally experience here in the Philippines and other countries in the tropics is more rain and more flooding, not less, little or no drought, not more. And these are indicators of cooling, not warming.

Recently, certain groups like the National Renewable Energy Board - a new bureaucracy created by the Renewable Energy Act of 2008 (Republic Act 9513) - are proposing to impose a carbon tax on non-renewable energy sources, like $1 per ton of imported coal. This is a rent-seeking move by the NREB and other lobbyists to demonize and make an affordable energy become more expensive. Renewables, like wind and solar power, will become “less costly” as they distort upward the prices of the non-renewables and impose an indirect tax to subsidize the renewables.

This indirect tax is called the feed in tariff scheme. Energy consumers - you and me - will pay FIT for the mandatory use of those expensive power sources. This will make our already high electricity bills more expensive. We have the highest electricity cost for industrial users in Asia: $0.18 per kilowatt-hour in 2010 as against $0.15 in Japan and Singapore, down to only $0.06 in Indonesia and Korea. Check out International Energy Agency, IMD World Competitiveness Online as well as Welfare Economics, Philippine Institutional Issues.

The role of government is to allow enterprises to seek cheaper and reliable power sources, and not play cronyism by taxing some power sources while subsidizing others. For now, coal will become cheaper as many industrialized economies shift to shale gas, and coal producers from those countries will sell lower to developing countries like the Philippines.

This is good news and will jibe with the high growth scenario of the government. Climate alarmism and renewable energy cronyism should not be allowed to distort this new development.
----------

See also: