Starting this year, I am changing the thread title from "Climate Stupidity" to "Climate Tricks". Some friends suggested that the former sounds too brutal and combative. I agree, somehow, so I will mellow down, will use the latter. After all, AGW has become scary and threatening due to various tricks used by the proponents of that hypothesis, like the "hockey stick" graph of global temperature as tricked by Prof. Michael Mann of Penn State U. And that is why it's also called "Mann-made warming."
This headline from The Canadian made just four years ago is really scary. Some 4.5 billion of us in this planet could die this year because of global warming. Anthony Watts of WUWT made this blog entry two days ago:
Be careful today and tonight, billions may die
UPDATE: January 1st, 2012 – still here, no reports of mass deaths at the last minute. – Anthony
Global warming may go on a last minute rampage. Maybe best to just stay at home and lock your doors, bar your windows, and turn your air conditioner on. If you live near the coast, head for high ground. Deaths due to drinking and driving will be nothing compared to this.
This story appeared in
The Canadian January 8th, 2007, it’s been a countdown example of stupidity ever since. Unbelievably, it is still on their website. Note today’s date....
Now, aren't you scared?
Also four years ago, Al Gore boldly predicted of an ice-free Arctic by 2014. Steven Goddard posted,
The 2007 Nobel Peace Prize
January 3, 2012
The Nobel Peace Prize winner in 2007 was of course sex poodle Al Gore and theHimalayas gone by 2035 IPCC. In his acceptance speech, Al Gore compared his brave work (lying to children for a fast buck) to that of fighting the Nazis. He predicted an ice-free Arctic by 2014.
We, the human species, are confronting a planetary emergency – a threat to the survival of our civilization that is gathering ominous and destructive potential even as we gather here. But there is hopeful news as well: we have the ability to solve this crisis and avoid the worst – though not all – of its consequences, if we act boldly, decisively and quickly.
However, despite a growing number of honorable exceptions, too many of the world’s leaders are still best described in the words Winston Churchill applied to those who ignored Adolf Hitler’s threat: “They go on in strange paradox, decided only to be undecided, resolved to be irresolute, adamant for drift, solid for fluidity, all powerful to be impotent.”
Last September 21, as the Northern Hemisphere tilted away from the sun, scientists reported with unprecedented distress that the North Polar ice cap is “falling off a cliff.” One …. new study, to be presented by U.S. Navy researchers later this week, warns it could happen in as little as 7 years.
Al Gore
Ok, here is the sea ice extent in the Arctic as of yesterday, January 2, 2012. Graph is from the Danish Meteorological Institute (DMI), Center for Ocean and Ice. The lowest level in 2011 was about 4.2 million sq. kms. of ice sometime in late September. The highest level was about 11.2 million sq. kms. of ice sometime in early March 2011.
The satellite picture as of two days ago, January 1, 2012, is from the National Snow and Ice Data Center (NSIDC).
Anything so scary and threatening about the Arctic ice? Hard data says No, while Al Gore and the UN -- IPCC, FCCC, WMO, UNEP, etc. -- say Yes.
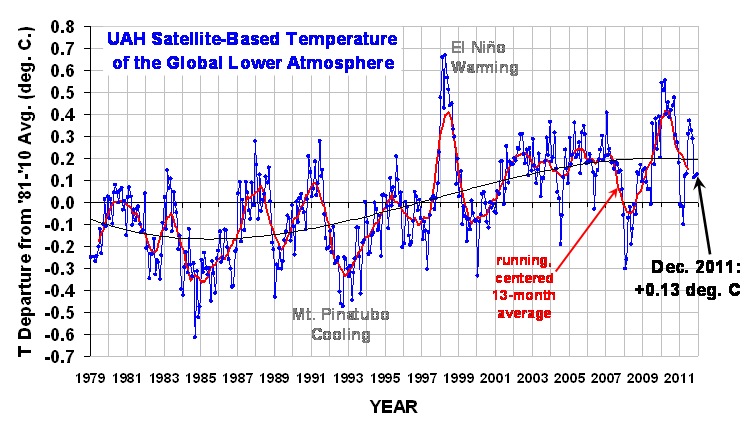
Meanwhile, here's the end-December 2011 global air and tropospheric temperature anomaly, from Dr. Roy Spencer of UAH,
http://www.drroyspencer.com/
January 3rd, 2012The global average lower tropospheric temperature anomaly for December, 2011 remained about the same November, +0.13 deg. C (click on the image for the full-size version):

The 3rd order polynomial fit to the data (courtesy of Excel) is for entertainment purposes only, and should not be construed as having any predictive value whatsoever.
Here are the monthly stats for 2010 and 2011:
YR MON GLOBAL NH SH TROPICS
2010 1 +0.542 +0.675 +0.410 +0.635
2010 2 +0.510 +0.553 +0.466 +0.759
2010 3 +0.554 +0.665 +0.443 +0.721
2010 4 +0.400 +0.606 +0.193 +0.633
2010 5 +0.454 +0.642 +0.265 +0.706
2010 6 +0.385 +0.482 +0.287 +0.485
2010 7 +0.419 +0.558 +0.280 +0.370
2010 8 +0.441 +0.579 +0.304 +0.321
2010 9 +0.477 +0.410 +0.545 +0.237
2010 10 +0.306 +0.257 +0.356 +0.106
2010 11 +0.273 +0.372 +0.173 -0.117
2010 12 +0.181 +0.217 +0.145 -0.222
2011 1 -0.010 -0.055 +0.036 -0.372
2011 2 -0.020 -0.042 +0.002 -0.348
2011 3 -0.101 -0.073 -0.128 -0.342
2011 4 +0.117 +0.195 +0.039 -0.229
2011 5 +0.133 +0.145 +0.121 -0.043
2011 6 +0.315 +0.379 +0.250 +0.233
2011 7 +0.374 +0.344 +0.404 +0.204
2011 8 +0.327 +0.321 +0.332 +0.155
2011 9 +0.289 +0.304 +0.274 +0.178
2011 10 +0.116 +0.169 +0.062 -0.054
2011 11 +0.123 +0.075 +0.170 +0.024
2011 12 +0.127 +0.197 +0.057 +0.043
Finally, there will be a symposium on geology and climate (alarmism) on Friday in UP.
“Your Daily Dose of Earth Science” Symposium
January 5, 2012
Audio-Visual Room, National Institute of Geological Sciences (NIGS)
University of the Philippines, Diliman, Quezon City
0905 Welcome Remarks
Dean Jose Maria Balmaceda, UP College of Science
0920 Keynote Address
Secretary Mario G. Montejo, Department of Science and Technology
1000 Climate Change after Durban
Dean Antonio G. M. La Viña (Dean, Ateneo School of Government)
1030 Renewable Energy Outlook
Dir. Mario C. Marasigan (Director IV, Renewable Energy Management Bureau, Department of Energy)
1100 Trends in Geosciences Education in the Philippines
Dr. Graciano P. Yumul Jr.
(Undersecretary for Research and Development, Department of Science & Technology)
1130 Promoting a Culture of Safety, Health, Environmental Protection and Social Development (SHES) in the Mining Industry
Engr. Louie R. Sarmiento (President, Philippine Mine Safety and Environment Association)
1330 Geology and the Management of Our Water Resources
Dr. Carlos Primo C. David (Professor, UP National Institute of Geological Sciences)
1400 Geology - Main Tool in Mineral Discoveries
Mr. Hernulfo B. Ruelo & Mr. Ciceron A. Angeles Jr. (Consultants)
1430 Can Nuclear Waste be Disposed of Safely?
Dr. Carlo A. Arcilla (Director, UP National Institute of Geological Sciences)
1530 Metro Manila Earthquake Impact Reduction Study
Dr. Renato U. Solidum Jr. (Director, Philippine Institute of Volcanology and Seismology)
1600 The National Geohazards Mapping & Assessment Program of the Mines & Geosciences Bureau-Department of Environment & Natural Resources
Dr. Karlo L. Queaño (Supervising Science Research Specialist, Mines & Geosciences Bureau)