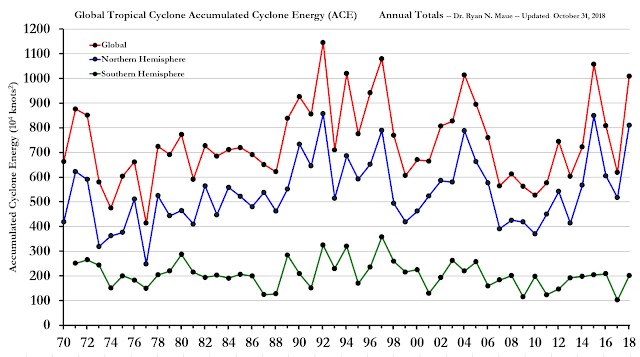
The usual argument by climate alarmism movement is that less rain or more rain, less flood or more flood, less storms or more storms, they are all "proof" of man-made climate change (CC). So regardless of the weather and climate, we should keep sending more money to the UN, governments, big international NGOs, etc. and they will "fight" CC. Scam.
No trend of "worsening" storms, hurricanes, typhoons. Either declining trend or a simple natural cycle of more storms followed by less storms and so on.
Four charts below about Tropical cyclone (TC) accumulated cyclone energy (ACE), from Dr. Ryan Maue, https://policlimate.com/tropical/.
See also:
No trend of "worsening" storms, hurricanes, typhoons. Either declining trend or a simple natural cycle of more storms followed by less storms and so on.
Four charts below about Tropical cyclone (TC) accumulated cyclone energy (ACE), from Dr. Ryan Maue, https://policlimate.com/tropical/.
1. Global Hurricane Frequency (all & major) -- 12-month
running sums. The top time series is the number of global tropical cyclones
that reached at least hurricane-force (maximum lifetime wind speed exceeds
64-knots). The bottom time series is the number of global tropical cyclones
that reached major hurricane strength (96-knots+). Adapted from Maue (2011)
GRL.
2. Last 4-decades of Global and Northern Hemisphere
Accumulated Cyclone Energy: 24 month running sums. Note that the year indicated
represents the value of ACE through the previous 24-months for the Northern
Hemisphere (bottom line/gray boxes) and the entire global (top line/blue
boxes). The area in between represents the Southern Hemisphere total ACE.
Last 4-decades of Global Tropical Storm and Hurricane
frequency -- 12-month running sums. The top time series is the number of TCs
that reach at least tropical storm strength (maximum lifetime wind speed
exceeds 34-knots). The bottom time series is the number of hurricane strength
(64-knots+) TCs.
Last 4-decades of Global Tropical Storm and Hurricane
Accumulated Cyclone Energy -- Annual totals. The Southern Hemisphere tropical
cyclone season occurs from July-June each calendar year. The graph is
constructed such that SH annual value for July 2014 - July 2015 is positioned
in 2015.
-------------
See also:
Climate Tricks 84, 97% climate consensus in Sicily, August 12, 2019
Climate Tricks 85, Sachs and UN anger at Trump, August 31, 2019
Climate Tricks 86, Cannibalism and eating bugs to 'save the planet', September 20, 2019


No comments:
Post a Comment