----------
(1) From NTZ,
Watershed Conference…German Coalition Government FDP Party To Hold FIRST EVER Skeptical Conference
Hell must have frozen over!
Climate science skepticism in Germany now has spread from a few once marginalized groups over to the junior member of Germany’s coalition CDU-FDP government, the Free Democrats Party (FDP). Hat tip: Ökowatch.
Coalition government FDP party invitation questions climate dogma – announces skeptical climate and energy conference.
The FDP is holding a skeptic conference at the end of this month. This is the first time any political party in Germany holds a “skeptic” conference, and thus marks a watershed event in Germany when it comes to climate science skepticism. Make no mistake – it’s a clear signal....
(2) From ICECAP, Joe D'Aleo,
Records and Extremes -- Updated
Looking back over the last century, you can explain global temperatures by ENSO and volcanism and the ocean multidecadal cycles that favor a particular ENSO state. Here is the plot since 1979 of all data sets with ENSO and volcanism indicated.
El Ninos bring a short term warming, La Ninas a dip in global temperatures. The warmn mode of
the Pacific from 1977 to 1998, led to a net warming. Major volcanoes produce a cooling as we
saw in the early 1980s and early 1990s, lack of volcanism (like we have seen since the middle
1990s) means more solar radiation at the surface and enhanced warming.
(3) From Dr. Roy Spencer,
UAH Global Temperature Update for May 2012: +0.29°C
June 4th, 2012
The global Average lower tropospheric temperature anomaly for May 2012 (+0.29 °C) changed little from April (+0.30 °C), with some warming to near-average temperatures in the tropics being balanced by a little cooling in the Southern Hemisphere (click on the image for the full-size version):
The 4th order polynomial fit to the data (courtesy of Excel) is for entertainment purposes only, and should not be construed as having any predictive value whatsoever.
Here are the monthly stats:
YR MON GLOBAL NH SH TROPICS
2011 04 +0.117 +0.195 +0.039 -0.229
2011 05 +0.133 +0.145 +0.121 -0.043
2011 06 +0.315 +0.379 +0.250 +0.233
2011 07 +0.374 +0.344 +0.404 +0.204
2011 08 +0.327 +0.321 +0.332 +0.155
2011 09 +0.289 +0.304 +0.274 +0.178
2011 10 +0.116 +0.169 +0.062 -0.054
2011 11 +0.123 +0.075 +0.170 +0.024
2011 12 +0.126 +0.197 +0.055 +0.041
2012 1 -0.089 -0.058 -0.120 -0.137
2012 2 -0.111 -0.014 -0.209 -0.276
2012 3 +0.111 +0.129 +0.094 -0.106
2012 4 +0.299 +0.413 +0.185 -0.117
2012 5 +0.289 +0.439 +0.139 +0.033
(4) From HockeySchtick,
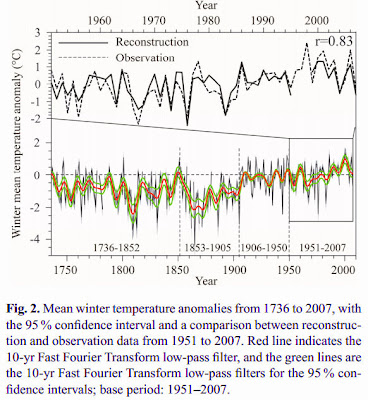
New paper finds climate warmed 3 times faster from 1862-1961; also 2007 temperatures same as in 1736
In another blow to the alarmist fallacy that the current warming period is 'unprecedented' or 'unusual,' a paper published today in the journal Climate of the Past finds that winter temperatures in China warmed at a rate almost three times faster over the 100 year period from 1862 to 1961 [1.89◦C/century] than over the 100 years from 1901 to 2000 [0.66◦C/century]. Furthermore, the reconstructed temperature anomaly at the beginning of the study period in 1736 [during the Little Ice Age!] was the about the same as in 2007.
From the conclusion: "The overall pattern of winter temperature variations during the past 300 yr is shown here. The climate in the 18th century was in a relatively cold phase, with a −0.76◦C mean temperature anomaly observed (for the reference period of 1951–2007). Then, in the 19th century, the climate enters the coldest period since 1736, showing a −1.18◦C mean temperature anomaly, and this century has been recognised by most reconstructions performed for the Northern hemisphere and China as one of the coldest (Jansen et al., 2007; Ge et al., 2010). Since the 20th century, the climate has entered a warming period. In particular, the mean temperature from 1981 to 2007 was 0.25◦C higher than that of 1951–2007, which reached the highest level of the past 300 yr. The warming rate during the 20th century from 1901 to 2000 was 0.66◦C/100 yr, which is lower than that from 1862 to 1961, when the rate was 1.89◦C/100 yr."
(5). From Steven Goddard,
Antarctic Temperature Drops Below The Freezing Point Of CO2
-------
See also:
Climate Tricks 5: CO2, Clouds and Positive Feedback, March 21, 2012
Climate Tricks 6: Using NASA for Political Science, April 11, 2012
Climate Tricks 7: On a "New Ice Age" and Temperature Cheating, May 01, 2012,
Climate Tricks 8: Catastrophic Scare for Climate Money, May 16, 2012
See also:
Climate Tricks 5: CO2, Clouds and Positive Feedback, March 21, 2012
Climate Tricks 6: Using NASA for Political Science, April 11, 2012
Climate Tricks 7: On a "New Ice Age" and Temperature Cheating, May 01, 2012,
Climate Tricks 8: Catastrophic Scare for Climate Money, May 16, 2012


No comments:
Post a Comment